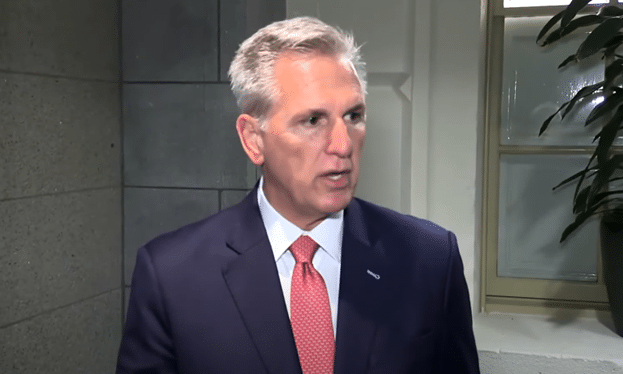
“Just confirmed by the non-partisan @USCBO… This will be the LARGEST SPENDING CUT that Congress has ever voted for in history. $2.13 Trillion!”
That was House Speaker Kevin McCarthy (R-Calif.) in a May 30 Twitter post pointing to a newly generated Congressional Budget Office (CBO) estimate of the Fiscal Responsibility Act legislation that increases the debt ceiling through 2024 and imposes spending caps currently being considered by Congress.
But is he correct? Are these the largest spending cuts in history?
One way to compare is as a percent of budget how it stacks up to the 2011 Budget Control Act, the previous largest spending caps ever imposed. At the time of passage, the Budget Control Act was projected by the CBO to reduce the deficit by $917 billion from 2012-2022: $741 billion from the discretionary spending caps or sequestration, $20 billion from reductions to mandatory spending and $156 billion as a result of less interest payments owed thanks to cutting spending.
The legislation also contemplated a further $1.2 trillion of cuts that would have been undertaken by a Joint Select Committee on Deficit Reduction, but as these were non-binding on the committee and their recommendations non-binding on future Congresses, for the purposes of this analysis, these will be discounted.
By comparison, the 2023 Fiscal Responsibility Act imposes spending caps totaling a bit more than $1.5 trillion: $1.3 trillion by similar discretionary spending caps, $11 billion for rescissions and $188 billion for interest saved thanks to the cuts, according to CBO.
The 2023 legislation also contemplates, as did the Budget Control Act, future reductions to baseline discretionary spending for 2026 to 2029, totaling $552 billion of reductions to outlays, but as these are prospective and have not been implemented, and so for the purposes of this analysis, they will also be discounted.
So, on a nominal basis, the $1.5 trillion of spending caps in the 2023 bill is larger than the $917 billion in the 2011 bill. But what about as a percent of discretionary spending, excluding mandatory spending like Social Security, Medicare, Medicaid and so forth, and then as a percentage of the total budget, including mandatory spending?
At the time of passage of the 2011 Budget Control Act, discretionary spending outlays were projected to total almost $14.5 trillion from 2012 to 2021, making the $917 billion of discretionary spending caps and mandatory spending reductions about 6.3 percent of discretionary spending.
As for the 2023 Fiscal Responsibility Act, the $1.5 trillion of spending caps comparatively accounts for 7.2 percent of the projected discretionary spending of $21.2547 trillion from 2024 to 2033. So, objectively, the 2023 cuts are larger than the 2011 cuts as a percent of discretionary spending at the time of passage, apples to apples, discounting future promised cuts in both pieces of legislation that were contemplated.
But what about when Social Security, Medicare, Medicaid and other mandatory spending set forth by statute based on individual qualification for benefits are included in the analysis?
Here, the 2011 Budget Control Act’s $917 billion of spending caps out of $47.3 trillion of then-expected outlays projected by the White House Office of Management and Budget (OMB) from 2012 to 2021 come in at 1.93 percent of the total budget.
And the 2023 Fiscal Responsibility Act’s $1.5 trillion of spending caps out of the now-expected $80.39 trillion of outlays by OMB, or 1.88 percent of the total budget.
So, even though the 2023 bill cuts more both nominally and as a percentage of discretionary spending than 2011, it cuts slightly less when taken as a percentage of the total budget. Therefore, the 2011 Budget Control Act actually cut slightly more out of the total budget than does the 2023 legislation.
The largest reason for that is that mandatory spending including Social Security, Medicare, Medicaid and so forth is set to take on an ever larger portion of total federal spending, with Social Security and Medicare being the largest current drivers as the Baby Boomer retirement wave continues en masse.
Whereas, in 2011, mandatory spending plus interest accounted for $2.38 trillion out of $3.77 trillion, or 63.1 percent of total spending.
In 2023, mandatory spending plus interest, $4.6 trillion out of $6.37 trillion, constitutes 72.7 percent of total spending.
And by 2033, mandatory spending plus interest, $7.75 trillion out of $9.95 trillion, will constitute a whopping 77.9 percent of total spending as the national debt is expected to swell from $31.4 trillion to today to a gargantuan $50.7 trillion by 2033. The Fiscal Responsibility Act appears that it would reduce the debt by 2033 to about $49.2 trillion instead of $50.7 trillion, barely scratching the surface. Maybe it buys a year? A few months?
Meaning, every decade that goes by, there is less and less that can be accomplished by Congress using discretionary spending caps alone. So, yes, the Fiscal Responsibility Act is considering some of the largest budget cuts in history by certain standards, but as a percentage of total spending, is no better than the 2011 Budget Control Act, which is to say it likely does not go far enough, showing that neglecting the mandatory spending side of the ledger and kicking the can down the road has made balancing the budget practically impossible — and continues to exact a mounting toll on U.S. taxpayers and creditors.
Robert Romano is the Vice President of Public Policy at Americans for Limited Government Foundation.


