

2.2 percent. That is what the annualized, inflation-adjusted growth rate of the economy is so far after three quarters in 2015, the Bureau of Economic Analysis reports.
To get 3 percent growth for the year — a milestone the U.S. has not achieved since 2005 — the economy will have to grow at an extremely robust 5.4 percent in the fourth quarter.
It won’t. It has not grown that fast since 2003 when it increased 6.9 percent annualized in the third quarter that year in the midst of the housing bubble, and right now, conditions still appear rather weak with Europe and Japan still in depression and emerging markets like China now in full-fledged correction.
All the while, interest rates are still quite low, so is consumer and producer inflation, credit demand is weak, and incomes remain flat.
As a result, 2006 to 2015 could very well end up being the slowest 10-year period of economic growth since 1930 to 1939, which clocked in at an average annual 1.33 percent growth rate. 2006 to 2014 is actually weaker at 1.29 percent, the worst readings since the GDP was invented as a measure in 1934.
So what gives?
Demographics, the Wall Street Journal’s Greg Ip wrote last week in a new series from that paper, 2050 Demographic Destiny: “[Economists] are now coming to realize that one of the stiffest headwinds is also one of the hardest to overcome: demographics. Next year, the world’s advanced economies will reach a critical milestone. For the first time since 1950, their combined working-age population will decline, according to United Nations projections, and by 2050 it will shrink 5 percent.”
And that will impact growth, Ip finds. “Previous generations fretted about the world having too many people. Today’s problem is too few. This reflects two long-established trends: lengthening lifespans and declining fertility. Yet many of the economic consequences are only now apparent. Simply put, companies are running out of workers, customers or both. In either case, economic growth suffers.”
This is a topic we have previously touched on at Americans for Limited Government starting in January, linking the slowdown of the working age population with the slow-growth economy. In the spirit of Ip’s analysis, we have gone back to U.S. Census Bureau data again to show the same relationship, this time linking nominal economic growth specifically to the percent growth annually of the 14-64 year old resident population from 1952 to 2014.
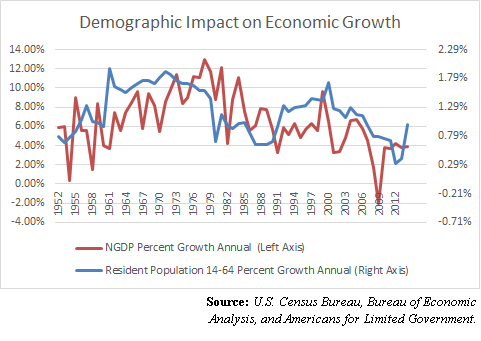
It is not perfect, but does appear to show the overall trend: rising working age populations coinciding with strong nominal growth, and slowing working age populations with weaker growth. As we noted in January, “The relationship is simple to understand, and based on laws of supply and demand. The faster the working age population grows, the more demand there will be, and the greater the consumption that will occur, all resulting in higher measured economic growth. And, as population growth slows, so too will demand soften, and less consumption will occur, resulting in lower measured growth.”
In other words, demographics may help explain not only the current slowdown, but also the post-war economic boom, including the Great Inflation of the 1970s, the slowdown at the latter end of the 1980s and the 1990s economic boom.
So, what does the future hold? Unfortunately, even slower growth, if U.S. Census Bureau population projections through 2050 are to be believed.
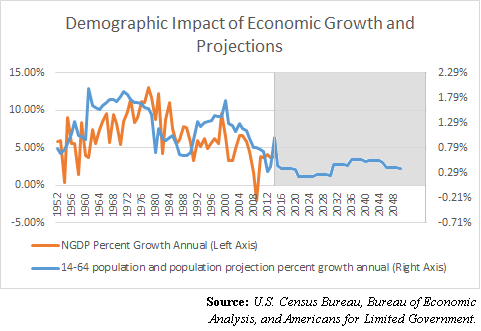
In fact, it will be the slowest growth of the working age population on record since the end of World War II, averaging just 0.39 percent growth annually. For context, it averaged 1.17 percent average annual growth from 1945-2014.
So what does it all mean?
Demographics matter. Aging populations and low fertility do not lead to prosperity. Some have argued those trends might be offset with immigration, but with our chain migration system, it might only exacerbate the issue, since for every working age person we bring in, we may also be taking in their parents, their grandparents in some cases, and so forth.
And with the median age of immigrants to the U.S. currently at about 43, according to the Migration Policy Institute, any temporary demographic gains from new immigrants may be offset within 20 years when those people reach retirement age, too.
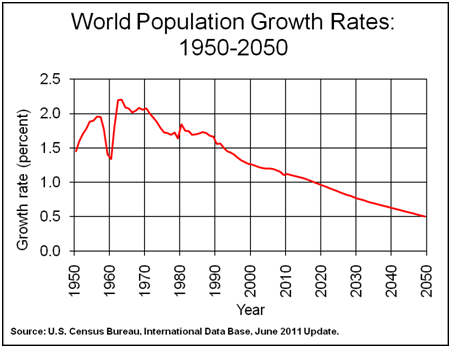
Besides, immigration might not be a long-term solution with slower population growth expected worldwide over the coming decades, if the U.S. Census Bureau’s International Data Base is to be believed, which similarly projects that the global population will continue flattening for the next 35 years, until it stops growing altogether.
Another problem is that as the working age populations of the world slow down and begin to even shrink — which could lead to deflation — debts owed, particularly by governments, will continue to rise, particularly due to massive health care and retirement costs from the postwar baby boom. Meaning, the rate of taxation per individual to pay for interest owed on the debt will only rise, which could hurt growth even more.
If it were not for the $18.7 trillion national debt and the massive credit bubble on which we sit — with over $59 trillion of debt outstanding nationwide according to the latest Federal Reserve data — these trends in demographics might otherwise be benign. Sure, growth would be slower, and so would job growth, but there would be fewer people seeking jobs and less goods and services to consume. It might just be a wash.
But combined with too much debt, demographic decline might risk a vicious cycle of debt deflation if action is not taken soon. Meaning, unless we can get our fiscal house in order and/or the working age population experiences a swift turnaround with a new baby boom, this could be the first of many lost decades to come.
Robert Romano is the senior editor of Americans for Limited Government.