
The Federal Reserve’s tapering of quantitative easing continues, dropping from $25 billion a month of securities to $15 billion, according to the central bank’s latest statement.
Since August 2007 when the financial crisis began, the Fed has dramatically expanded its balance sheet by $3.5 trillion, from $907.5 billion to $4.493 trillion.
Today’s total includes $2.446 trillion U.S. treasuries, compared with a 2007 level of $907.5 billion, and $1.7 trillion mortgage-backed securities guaranteed by Fannie Mae, Freddie Mac, and Ginne Mae (the underwriter for Federal Housing Administration (FHA) and Veterans Affairs loans).
When quantitative easing, particularly on the mortgage-backed securities side of the equation, was announced on November 25, 2008, the Fed promised it would “reduce the cost and increase the availability of credit for the purchase of houses, which in turn should support housing markets and foster improved conditions in financial markets more generally.”
In the Fed’s most recent statement, the purpose of still continuing the program, even as it winds down, is to “maintain downward pressure on longer-term interest rates, support mortgage markets, and help to make broader financial conditions more accommodative.”
In other words, the reason for printing $3.5 trillion was to boost lending, and kick start financial markets, which had seized up in 2008.
But, now that the program is almost over — well, supposedly they’re going to stop buying new paper, but they’ll keep rolling over their $3.5 trillion of existing paper as it matures — the question is, did it work?
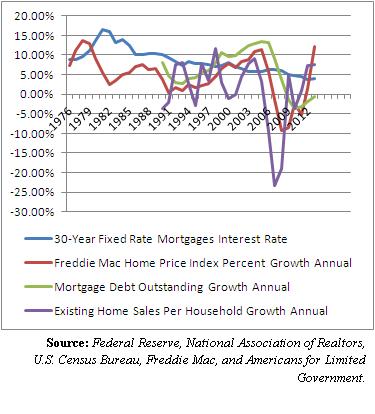
Has it boosted mortgage credit? No. Mortgages outstanding have decreased an average 2.13 percent a year every single year of quantitative easing, from a 2008 high of $14.77 trillion to a current level of $13.26 trillion in 2013.
Has it led to higher home sales? Not really. Existing home sales per household — that is, existing home sales divided by the number of households — at 0.0414 are lower now than where they were in 1996, 0.0418, based on data compiled by the National Association of Realtors and the U.S. Census Bureau.
Sales per household have increased 3.39 percent a year during the quantitative easing years 2009-2013. That’s no better than 1989-2005, right before the bubble popped, at 3.72 percent growth a year when there was no quantitative easing.
Has it led to lower interest rates? Hard to say, but probably not, since mortgage interest rates have been collapsing for more than 30 years, from a 1981 high of 16.63 percent to a 2013 level of 3.94 percent. Unless one wants to argue that rates were collapsing that whole time because of the Fed’s policy rate, which was also collapsing during that time. But, that’s an argument in favor of the policy rate moving rates down, not quantitative easing.
Has it led to higher home values? Perhaps it has — those have recovered during quantitative easing — they are now at their 2004 levels roughly, according to the Freddie Mac Home Price Index. Back then, there was no quantitative easing.
So, quantitative easing can really take no credit for home sales, lower interest rates, or increasing mortgage debt. And maybe not even home values, which appear to share a stronger correlation with home sales than Fed asset purchases.
In short, there is little to no evidence that quantitative easing achieved any of its stated objectives.
While it is impossible to know what the counterfactual might have been — what would have happened without the asset purchases? — with tapering almost complete, it appears housing markets will continue to function without further easing by the Fed.
So, what was the point?
Perhaps, then, there is an alternate explanation for quantitative easing. Maybe it wasn’t to recover home markets per se. Maybe all it did at the end of the day was help banks sell bad mortgage paper and clean up their balance sheets. Just saying.
Robert Romano is the senior editor of Americans for Limited Government.