
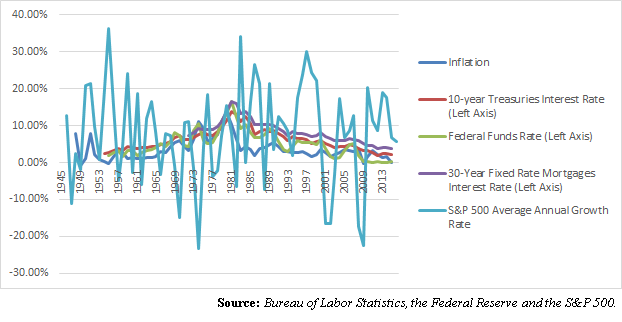
Everybody knows that interest rates are low, and have been in decline for over three decades. For example, in 1981 the 30-year fixed rate mortgage peaked at 16.63 percent. In 2015, it was down to 3.85 percent. On Sept. 9, according to Bankrate.com, the downward march has continued, with the rate falling to 3.37 percent.
So, too has consumer inflation dropped dramatically since that period, from a peak of 13.6 percent in 1980 all the way down to 0.12 percent in 2015.
One thought about very low interest rates — which whether you’re talking about 10-year treasuries at about 1.6 percent or even the federal funds rate still near-zero percent — is that they make other higher yielding investments like stocks far more attractive.
And certainly that’s been historically true, depending where you want to look. While interest rates were rising in the 1970s, along with inflation and particularly oil prices, it created a major disincentive against investing in equities. From 1971 to 1980, using monthly data averaged out for each year, the S&P 500 only grew by about an average annual 3.7 percent a year. In the meantime, by 1980, inflation was more than triple that, again, at 13.6 percent. Bonds, ultra-high interest rates, gold and other commodities were the safe havens.
More recently, since 2010, the S&P 500 has been running really hot, averaging 13.97 percent average annual growth a year amid very low — and dropping — interest rates. Money chases yield, so this outcome is not necessarily surprising. As rates have dropped pensioners and those saving for retirement have been forced into higher-yielding investments.
So, it’s an open and shut case, right? Low interest rates fuel higher yielding equities, and vice versa.
But what if the past 6 years of performance was actually a misleading indicator? Going back further in time, from 2000 through 2015, the S&P has only grown by an average 3.8 percent a year. That includes two major upturns, and two major downturns.
This year, it’s only grown 3.3 percent since the start of the year.
That compares with the 1945 to 1999 average of 9.23 percent growth a year on the S&P 500.
From this perspective, the slowdown in the growth of equities has coincided with other troubling indicators. For example, economic growth has not been above an inflation-adjusted 4 percent since 2000, and not above 3 percent since 2005. In 2016, so far, it is only growing at 0.9 percent annualized.
Nominal household median income has only grown at an average annual 1.88 percent a year since 2000 according to data compiled by the U.S. Census Bureau. The 16 years before that it was growing an average annual 4.16 percent.
Employment has only grown 0.69 percent a year since 2000 according to data compiled by the Bureau of Labor Statistics. The 16 years before that jobs grew by 1.77 percent a year.
What emerges when looking at stocks is a view that while incredibly volatile — the booms have been big, and so too have the busts — but when you average it out, even now equities appear to be subject to fundamentals.
In other words, since the financial crisis abated, stocks have had a terrific run. But what goes up must eventually come down. Besides interest rates can only stay low for so long. Just on Friday, Boston Fed President Eric Rosengren said in a speech that the economy could overheat if the Fed did not engage in a path of gradually increasing interest rates. That knocked down the S&P 500 by 2.45 percent in a single day.
That may not mean another bear market is on the horizon. As usual, it’s hard to say, but clearly the traditional view of higher interest rates being bad for stocks has come back into play as investors anticipate another rate hike from the Federal Reserve.
But it also raises a troubling question if indeed another downturn is upon us. Again, from 2000 to present, the rate of return has been 3.8 percent. So, what if the conventional assumption of 8 percent a year perpetual growth of equities is no longer a sure thing? What would that mean?
For starters, investors would loathe to be stuck in a bear market, particularly given the magnitude of the last two major corrections, which coincided with recessions: a 33 percent correction in 2001 and 2002 combined, and a 40 percent downturn in 2008 and 2009.
Fool us once, shame on you. Fool of twice, shame on us. But three times?
Why would anyone sit around and wait for that to happen again? Investors would obviously want to book their gains so if and when recession strikes again, they can buy in again when the bottom comes. The suckers will stay in though the next downturn. Which is exactly what happened to long-term savers in 2008, where 401(k) and IRA savings accounts lost about 14 percent on average. Why didn’t they sell the highs?
Perhaps there is an institutional incentive not to sell in order to keep funds liquid. Maybe it would crash markets. Besides, if everyone tried to sell, who would buy?
Still, looking at the longer term, another 16 years like the last 16 years could risk throwing retirement savings into much disarray. Suddenly the incentive to pour money into lower yielding investments over time based on a steady rate of return without looking would no longer be there.
The incentive would be to buy the lows, and sell the highs, because the long-term rate of return is not what it used to be. Indeed, given the volatility of this period, there could be a lot of evidence to suggest this is already happening. What that means for the future is rather uncertain, though. For every seller, there has to be a buyer. Meaning, if you’re waiting for the rush to the exits in the next downturn, you might be waiting too long.
Robert Romano is the senior editor of Americans for Limited Government.